Types of Samples
Although there are different methods that might be used to create a sample, they generally can be grouped into one of two categories: probability samples or non-probability samples.
Probability Samples
The idea behind this type is random selection. More specifically, each sample from the population of interest has a known probability of selection under a given sampling scheme. There are four categories of probability samples described below.
-
Simple Random
Sampling The most widely known type of a random sample is the simple random sample. This is characterized by the fact that the probability of selection is the same for every case in the population. Simple random sampling is a method of selecting n units from a population of size N such that every possible sample of size n has equal chance of being drawn. Imagine you want to carry out a survey of 100 voters in a small town with a population of 1,000 eligible voters. We could write the names of all voters on a piece of paper, put all pieces of paper into a box and draw 100 tickets at random. These 100 form our sample where every name in the box had the same probability of being chosen.
-
Stratified Random
Sampling In this form of sampling, the population is first divided into two or more mutually exclusive segments based on some categories of variables of interest in the research. It is designed to organize the population into homogenous subsets before sampling, then drawing a random sample within each subset. With stratified random sampling the population of N units is divided into subpopulations of units respectively. These subpopulations, called strata, are non-overlapping and together they comprise the whole of the population.
When these have been determined, a sample is drawn from each, with a separate draw for each of the different strata. The primary benefit of this method is to ensure that cases from smaller strata of the population are included in sufficient numbers to allow comparison. For example, you may be interested in how job satisfaction varies by ethnicity among a group of employees at a firm. To explore this issue, we need to create a sample of the employees of the firm. However, the employee population at this particular firm is predominantly Trinidadians, as the following chart illustrates: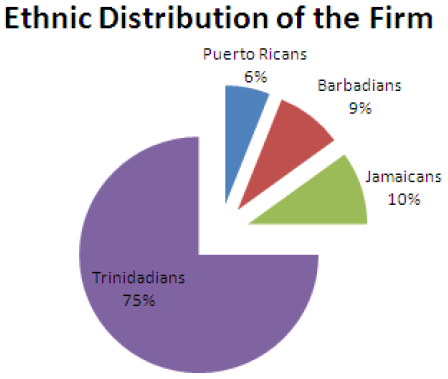
If we were to take a simple random sample of employees, we may end up with very small numbers of Jamaicans, Barbadians and Puerto Ricans. That would not be good for research, since we might end up with too few cases for comparison in one or more of the smaller groups. Instead of taking a simple random sample from the population, a stratified sampling method can be used to ensure that appropriate numbers of elements are drawn from each ethnic group in proportion to the percentage of the population as a whole. For example, if we want a sample of 1000 employees - we would stratify the sample by ethnicity (group of Trinidadians employees, group of Jamaican employees, group of Barbadian employees and group of Puerto Rican employees), then randomly draw out 750 employees from the Trinidadian group, 90 from the Barbadian group, 100 from the Jamaican group and 60 from the Puerto Rican group. This yields a sample that is proportionately representative of the firm as a whole.
-
Systematic Sampling
This method of sampling is at first glance very different from simple random sampling. In practice, it is a variant of simple random sampling that involves some listing of elements - every nth element of list is then drawn for inclusion in the sample. Say you have a list of 10,000 people and you want a sample of 1,000.
Creating such a sample includes three steps:
- Divide number of cases in the population by the desired sample size. In this example, dividing 10,000 by 1,000 gives a value of 10.
- Select a random number between one and the value attained in Step 1. In this example, we choose a number between 1 and 10 - say we pick 7.
- Starting with case number chosen in Step 2, take every tenth record (7, 17, 27, etc.).
More generally, suppose that the N units in the population are ranked 1 to N in some order (e.g., alphabetic). To select a sample of n units, we take a unit at random, from the 1st k units and take every k-th unit thereafter.
The advantages of systematic sampling method over simple random sampling include:
- It is easier to draw a sample and often easier to execute without mistakes. This is a particular advantage when the drawing is done in the field.
- Intuitively, you might think that systematic sampling might be more precise than simple random sampling. In effect it stratifies the population into n strata, consisting of the 1st k units, the 2nd k units, and so on. Thus, we might expect the systematic sample to be as precise as a stratified random sample with one unit per stratum. The difference is that with the systematic one the units occur at the same relative position in the stratum whereas with the stratified, the position in the stratum is determined separately by randomization within each stratum.
-
Cluster Sampling
In some instances the sampling unit consists of a group or cluster of smaller units that we call elements or subunits (these are the units of analysis for your study). There are two main reasons for the widespread application of cluster sampling. Although the first intention may be to use the elements as sampling units, it is found in many surveys that no reliable list of elements in the population is available and that it would be prohibitively expensive to construct such a list. In many countries there are no complete and updated lists of the people, the houses or the farms in any large geographical region.
Even when a list of individual houses is available, economic considerations may point to the choice of a larger cluster unit. For a given size of sample, a small unit usually gives more precise results than a large unit. For example a SRS of 600 houses covers a town more evenly than 20 city blocks containing an average of 30 houses apiece. But greater field costs are incurred in locating 600 houses and in traveling between them than in covering 20 city blocks. When cost is balanced against precision, the larger unit may prove superior.
Non-probability Sampling
Social research is often conducted in situations where a researcher cannot select the kinds of probability samples used in large-scale social surveys. For example, say you wanted to study homelessness - there is no list of homeless individuals nor are you likely to create such a list. However, you need to get some kind of a sample of respondents in order to conduct your research. To gather such a sample, you would likely use some form of non- probability sampling.
To reiterate, the primary difference between probability methods of sampling and non-probability methods is that in the latter you do not know the likelihood that any element of a population will be selected for study.
There are two primary types of non-probability sampling methods:
-
Availability Sampling
Availability sampling is a method of choosing subjects who are available or easy to find. The primary advantage of the method is that it is very easy to conduct, relative to other methods. A researcher can merely stand out on his/her favorite street corner and distribute surveys. One place this method is popular is in university courses. For example, all students taking introductory sociology courses would have been given a survey and compelled to fill it out.
The primary problem with availability sampling is that you can never be certain what population the participants in the study represent. The population is unknown, the method for selecting cases is haphazard, and the cases studied probably do not represent any population you could come up with.
-
Quota Sampling
Quota sampling is designed to overcome the most obvious flaw of availability sampling. Rather than taking just anyone, you set quotas to ensure that the sample you obtain represents certain characteristics in proportion to their prevalence in the population. Note that for this method, you have to know something about the characteristics of the population ahead of time. Say you want to make sure you have a sample proportional to the population in terms of gender - you have to know what percentage of the population is male and female, then collect sample until yours matches.
The primary problem with this form of sampling is that even when we know that a quota sample is representative of the particular characteristics for which quotas have been set, we have no way of knowing if sample is representative in terms of any other characteristics. If we set quotas for gender and age, we are likely to attain a sample with good representativeness on age and gender, but one that may not be very representative in terms of income, education or other factors.
Sources of Data
Data can be divided into primary data and secondary data.
Primary data – this is data that you collect yourself such as when you do a survey or interview or self-observation.
Secondary data – this is when someone else collected the data for you or the data already exist.
Primary Sources of Data
- Interviews
- Letters
- Diaries
- Autobiographies
- Photographs
Secondary Sources of Data
- Books
- Internet articles
- Journal articles
- Thesis/Dissertations
- Biographies
Methods of Collecting Survey Data
A survey is a type of research design while an interview or a postal questionnaire is a method of data collection. The main methods of collecting survey data are:
- Face-to-face interviews
- Telephone interviews
- Questionnaires
- Focus Groups
The selection of the appropriate method mainly depends on the access to potential participants/respondents.
Face-to-face Interviews
Face-to-face or personal interviews are highly labour intensive but can be the best way of achieving high quality data. Face-to-face interviews are preferable:
- When the subject matter is very sensitive, but not personal.
- If the questions are very complex.
- If the interview is likely to be lengthy.
Face-to-face interviews are more expensive than other methods but they can collect more complex information and are also useful when the subject matter is not of great personal interest to the respondent who would be unlikely to complete a postal questionnaire.
Telephone interviews
Telephone interviews can be a very effective and economical way of collecting quantitative data if the individuals in the sampling frame can all equally be accessed via a telephone and if the questionnaire is short. This may not be an appropriate method for a deprived population where telephone ownership is likely to be low, but can be ideally suited to a busy professional respondent, such as a social worker if prior appointments are made. Telephone interviews are particularly useful when the respondents to be interviewed are widely geographically distributed.
Questionnaires
Questionnaires are a useful option to consider when conducting a survey including a postal survey. They can be cheaper than personal interviewing and quicker if the sample is large and widely dispersed. Due to the lack of personal contact between the respondent and the researcher, the design and layout of the questionnaire is all important. In terms of mailed questionnaires, these should be accompanied by a covering letter and include a stamped, addressed envelope. In general, postal surveys tend to have lower response rates than face-to-face or telephone interviews. However, questionnaires sent to populations with a covering letter from their general practitioner tend to have very high response rates. Alternative to mailing the questionnaire, it is possible to distribute the questionnaires directly to the potential respondents.
Focus Groups
Focus groups have a combination of interviews and participation observation. Focus groups are where 8-12 persons are grouped together to discuss a selected topic to research. The advantages of focus groups are that data are more accurate, low cost and there is greater pool of expertise. The possible weaknesses are that careful training is needed and data are more difficult to analyse.
Quantitative Research
Researchers who use quantitative research employ experimental methods and quantitative measures to test hypothetical generalizations and they also emphasize the measurement and analysis of causal relationships between variables. To illustrate the meaning of quantitative research for its use in explaining social problems, charts and graphs illustrate the results of the research.
Qualitative research
Qualitative research is defined as any kind of research that produces findings not arrived at by means of statistical procedures or other means of quantification. It is the kind of research that produces findings arrived from real-world settings where the phenomenon of interest unfold naturally.
Mixed Methods
Mixed methods can be defined as a method that focuses on collecting, analyzing, and mixing both quantitative and qualitative data in a single study or series of studies. Its central premise is that the use of quantitative and qualitative approaches, in combination, provides a better understanding of research problems than either approach alone.
Reliability and Validity
Reliability is the extent to which results are consistent over time and an accurate representation of the total population under study. In addition, if the results of a study can be reproduced under a similar methodology, then the research instrument is considered to be reliable.
The question that needs to be asked is “Can the source be trusted to provide accurate information?” A major concern therefore is that of authority.
In evaluating reliability, we need to look at the following:
- Author – is the author an expert in the area?
- Professional standards – academic authors who publish work in academic journals are supposed to follow certain standards.
- Publisher – is the publisher reputable?
- Organization or institution – if the data are from an organization, there is need for this organization to be reputable such as a central bank.
Validity
Validity determines whether the research truly measures that which it is intended to measure or how truthful are the research results. In other words, does the research instrument allow the researcher to be precise about the research object?
The question that needs to be asked here is “Is the data based on sound reasoning?” A source could have a high level of reliability such as an academic research paper that is published in an academic journal by a leading expert in the field, but the data may have a low level of validity in that it may be out of date.
In evaluating validity, we need to look at accuracy and bias.
Accuracy
The following are the aspects to evaluate accuracy of sources and information:
- Currency – the information needs to be modern and current and not out of date.
- Relevance – the data need to apply to the circumstances. For example, data for the USA on a particular topic may not apply to the Caribbean.
- Data collection – the data collection method must be dependable such as a survey.
- Sample size – the sample size must be large to represent the population. For example, we cannot interview one person to represent an entire population.
- Replicable – other sources must have similar information. If the same research is done under similar circumstances, similar results should be produced.
Bias
The following are the aspects to evaluate bias of sources and information:
- Representation – the sample must include all variables.
- Cultural bias – if the researcher is of a particular culture, that person should not be selected to obtain information for a research about his/her culture.
- Political bias – a person belonging to a particular political party should not be selected to do research on an issue involving politics.
- Social bias – a woman’s perspective about gender issues may differ from that of a man’s perspective.
- Faulty research methods – this can produce mistakes.
The Internet as Source
Researchers can find a huge range of data from the internet. The following are some things to look for when testing reliability and validity of information using the internet:
- Check the author’s credentials.
- Check to see if the source is reputable. Look for addresses ending in .gov and .edu as these tend to be good sources.
- See if there is an author sponsor.
- Check for contact information.
- Check for a copyright symbol © is on the page.
- Ensure that the website is kept up-to-date and is being maintained.
- Verify the information on the website to see if the information is consistent with the general consensus.