The Law of Demand - Movement along a Demand Curve
Demand is the willingness and ability of consumers to pay for their wants and needs. For example, you may want a cellphone but you must be able to pay for it in order for demand to exist. While demand is the willingness and ability of consumers to pay for their wants and needs, quantity demanded is that demand that relates to a particular price.
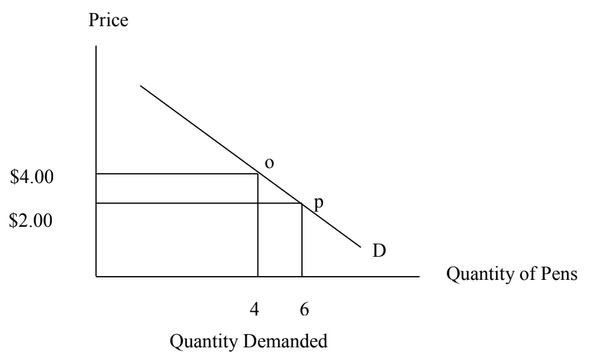
There is an inverse relationship between price and quantity demanded. As price increases, caeteris paribus, quantity demanded for a product will fall; likewise, when the price decreases, quantity demanded for the product will rise. This is what is referred to as the law of demand. Quantity demanded in influenced by the price and the price only and it is reflected as a movement along the demand curve only; not a shift of the entire demand curve. For example, as shown in the following graph, if the price of pens decreases from $4.00 to $2.00, quantity demanded will increase from 4 pens to 6 pens and this will be depicted as a movement along the demand curve from point o to point p.
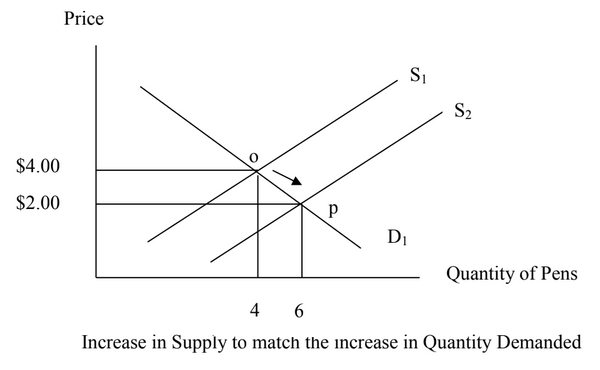
As stated earlier, demand is the willingness and ability of consumers to pay for their wants and needs. In response to this increase in quantity demanded, supply will now have to increase in order to facilitate the increase in quantity demanded. Supply curve now shifts from S1 to S2 as in the following graph.
The Law of Demand - Shift of the Demand Curve
The above illustrates the case of quantity demanded. On the other hand, demand is the overall demand picture and is depicted as a shift of the entire demand curve (not a movement along the curve). This shift in the entire demand curve is as a result of changes in market forces which are called factors or determinants of demand such as follows:
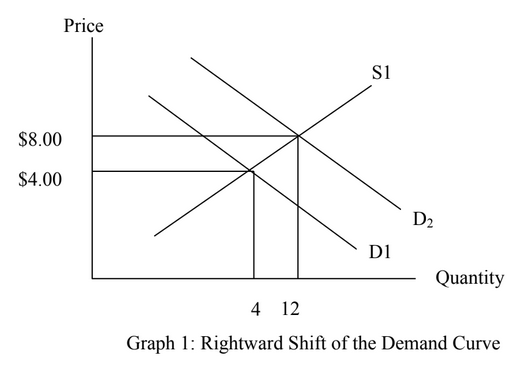
Income – when income of persons increases, caeteris paribus, their ability to purchase a particular good will increase and the demand for that good will increase. Therefore, its demand curve will shift to the right from D1 to D2 as in Graph 1. As a result, price increases from $4.00 to $8.00 and demand increases from 4 units to 12 units.
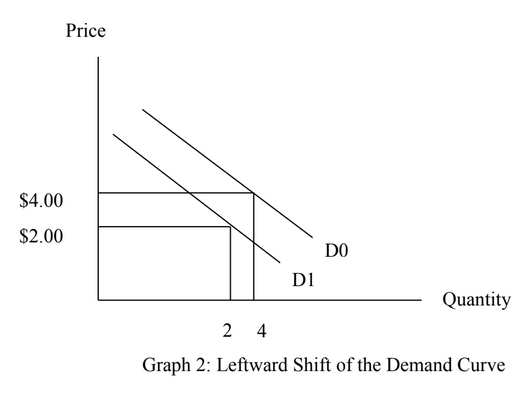
On the other hand, if income falls, demand will fall and the demand curve will shift from D0 down to D1. As a result, price will fall from $4.00 to $2.00 and demand will decrease from 4 units to 2 units as can be seen in Graph 2.
Price of Substitutes – ceteris paribus, when the price of a substitute good increases relative to the price of the good in consideration, the demand for the good in consideration will increase. For example, if the price of butter increases relative to cheese, the demand for cheese will rise and the demand curve for cheese will shift from D1 to D2. As a result, price increases from $4.00 to $8.00 and demand for cheese will increase from 4 units to 12 units as shown in Graph 1.
Price of Complement goods – when the price of complement good increases, ceteris paribus, the demand for the good in consideration will fall because both goods go together. The demand curve for the good in consideration will shift to the left from D0 to D1 resulting in demand falling from 4 units to 2 units and price falling from $4.00 to $2.00 as shown in Graph 2.
Advertising – when a company starts a huge advertising campaign to publicize a good or product, one can expect to see an increase in the demand for that particular good. The demand curve will therefore shift to the right from D1 to D2. As a result, price increases from $4.00 to $8.00 and demand increases 4 units to 12 units as shown in Graph 1.