The Market
A market is defined as the interaction of all buyers and sellers in a particular sector or industry whose activities influence the price of the product or service in that industry. There are two sides to a market: 1) demand and 2) supply. Demand is the willingness and ability of consumers to pay for their wants and needs. On the other hand, supply is the willingness and ability of firms or businesses to make available goods and services to meet the wants and needs of consumers.
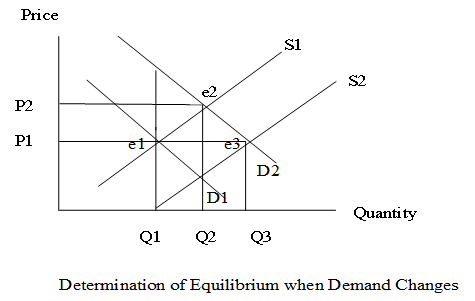
Determination of Equilibrium
Equilibrium price is also called market clearing price because at this price the exact quantity that producers take to market will be bought by consumers and there will be no surplus or shortage. Equilibrium is where demand (D1) equals supply (S1) such as at point e1 as in the following graph. At this point, there is no surplus or shortage and price will be P1 and demand is Q1. There are times when the equilibrium position may change. For example, demand may increase which may cause a rightward shift of the entire demand curve from D1 to D2.
When demand rises from D1 to D2, there will be a shortage (the difference between Q1 and Q2). Due to this shortage, there will be an upward pressure on price to increase and this will be at P2. The new equilibrium is where D2 equals S1 at point e2. Because of this increased demand (distance between Q1 and Q2) and increased price (P1 to P2) along with the possibly of there being more suppliers entering the industry, manufacturers would want to increase their supply which will result in the supply curve shifting from S1 to S2. This will result in quantity supplied being increased to Q3 and price falling from P2 back to P1. The end result of all these changes in the system for this particular product is the situation being settled where demand will be Q3 and price falling back to P1 because of the now increased number of suppliers in the industry. New equilibrium will be where demand (D2) and supply (S2) such as at e3 as can be seen in the following graph.