Relations
The equation, y= 8x+4, is a relation. A relation is defined as a set of ordered pairs that conforms to a specific rule. So with the equation, y= 8x+ 4, the specific rule that applies is:
when, x = 2
y = 8(2) + 4
y = 16 + 4
y = 20
This results in the ordered pair of when x = 2 , y = 20 or (x, y) which is (2, 20)
Relations can also be showed using arrow diagrams which show the relation between, x and y values for the equation, y = 8x+ 4.
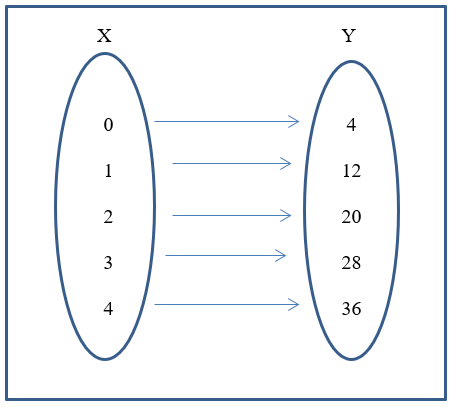
The y values in the arrow diagram above were obtained by substituting the respective x values in the equation, y =8x + 4, for x.
Functions
A function is a relation in which each member of the domain (the set of x values) is mapped to only one member of the range (the set of y values), that is, each x value corresponds to a particular y value
Example of a One to One mapping
Using the equation, f(x) = 8x + 4
Where, f(x) means ‘the function of x is 8x + 4’
and, y = f(x).
The following is an example of a one-to-one mapping.
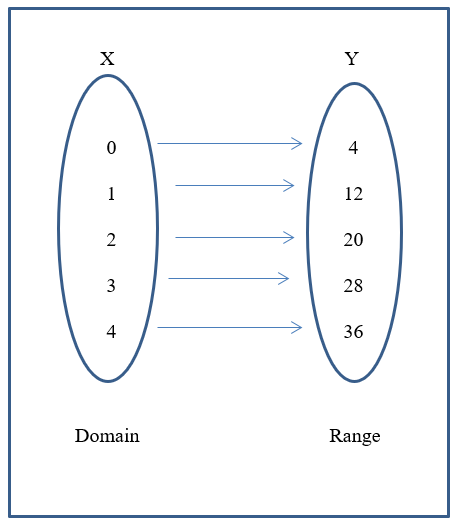
Recall the y values are obtained by substituting the domain values for x in the equation.
That is, when x = 1
y = 8(1) + 4
y = 12
Linear Functions
Linear functions are those of the form, f(x) = ax + c or y = mx + b, where a and c are integers. Linear means a straight line.
If y = ax + c
Then y is the dependent variable
a is the coefficient of x
x is the independent variable
c is the constant term.
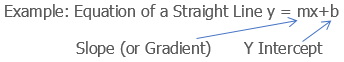
Note also that, y = mx + c is the equation of a line
Therefore, y = ax + c = mx + b
where, m is the gradient or slope of the line and b is the point at which the line intercepts the y axis.
A linear equation or function can be graphed.
We want to draw the graph of the linear function, f(x) = 2x + 2 which is y = 2x + 2, for the domain -2 ≤ x ≤ 2.
Substitute the values given for x in the domain (-2, -1, 0, 1, 2), in the function, solving for the respective f(x)/ y values.
Given, f(x) = 2x + 2
Then, f(-2) = 2(-2) + 2 = -4 + 2 = -2
f(-1) = 2(-1) + 2 = -2 + 2 = 0
f(0) = 2(0) + 2 = 0 + 2 = 2
f(1) = 2(1) + 2 = 2 + 2 = 4
f(2) = 2(2) + 2 = 4 + 2 = 6
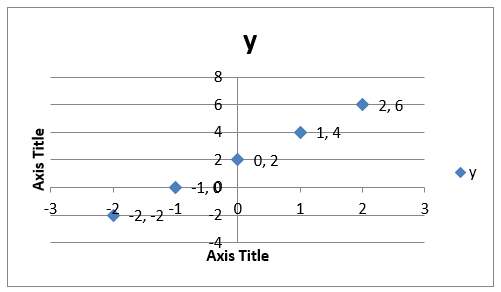
Therefore, the set of (x, y) values to be plotted and connected in forming the linear function are:
{(-2, -2), (-1, 0), (0, 2), (1, 4), (2,6)}
The graph of y= 2x + 2 is as follows:
Equation of a Line
There are different ways in which to find the equation of a line.
Method 1: Slope-Intercept Form
In this case, the graph of a line is given and the question requires finding the equation of the line. Substitute the co-ordinates of the points in the equation and solving for m and b.
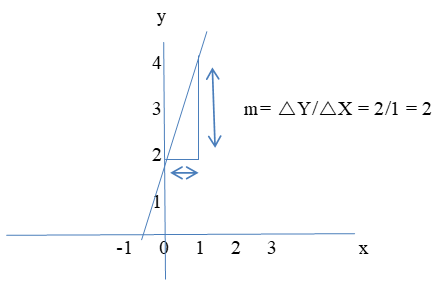
m = Change in y divided by the change in x or 2/1 = 2
b = 1 (where the line crosses the y-axis)
So: y = 2x + 1
You can also find the equation of a line when both the x and y values are given such as follows:
Find the equation of the straight line that has slope m = 4 and passes through the point (2,4).
In the slope-intercept form of a straight line, we have y, m, x, and b. We know that x=2, y=4 and slope or m = 4 so we have to calculate for b which is the intercept.
y = mx + b
(4) = (4)(2) + b
4 = 8 + b
–4 = b
Then the line equation must be y = 4x – 4.
Method 2: Point-Slope Form
In this method, the co-ordinates of the two points can be used to find the gradient of the line (m) using the following equation:
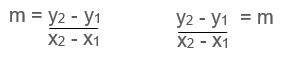
and after manipulating this equation, we get the point slope equation by solving for y − y1 such as follows:
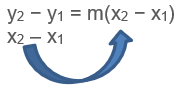
to be:
y2 − y1 = m(x2 − x1)
So using the same information as in the above example we have:
y – 4 = 4(x – 2)
y – 4 = 4x – 8
y = 4x – 4
Method 3: Standard Form of an Equation
Standard form of an equation is Ax + By = C, where A, B and C are real numbers and A and B are not both zero.
Notice that we got the same equation using both the slope intercept form and the point slope form. We can also convert the results from the point-slope form to the standard form of an equation which is as follows:
So to write the above results, y = 4x – 4 in standard form, we more the x term to the left of the equation by subtracting it on both sides of the equation to get:
-4x + y = -4
Because the x term must be positive, we must multiply the entire equation by -1 to get the following:
4x – y = 4.
Determining Parallel and Perpendicular Lines
Parallel Lines
Two lines or equations are parallel when they have the same slope. The two main methods of determining parallel lines from equations are:
Method 1: Comparing the slopes of each Line
Procedure:
-
Define the formula for slope. The slope of a line is defined by (y2 - y1)/(x2 - x1) where x and y are the horizontal and vertical coordinates of points on the line. You must define two points on the line to calculate this formula (x, y).
-
Identify the x and y coordinates of two points on each line. A point on a line is given by the coordinate (x, y) where x is the location on the horizontal axis and y is the location on the vertical axis. To calculate the slope, you need to identify two points on each of the lines in question. For example: line one line has the points (2, 3) and (-2, 4) while the other line has the points (4, 2) and (1, -3).
-
Plug the points for each line into the slope formula. To actually calculate the slope, simply plug in the numbers, subtract, and then divide.
"$m = \frac{4 - 3}{-2 - 2} = \frac{1}{-4} = - \frac{1}{4}$"
"$m = \frac{-3 - 2}{1 - 4} = \frac{-5}{-3} = \frac{5}{3}$"
- To compare the slopes of each line. Remember, two lines are parallel only if they have identical slopes. Lines may look parallel on paper and may even be very close to parallel, but if their slopes are not exactly the same, they are not parallel.
- In this example, -1/4 is not equal to 5/3 and so these two lines are not parallel.
Method 2: Using the Slope-Intercept Formula
Procedure:
-
Define the slope-intercept formula of a line. The formula of a line in slope-intercept form is y = mx + b, where m is the slope, b is the y-intercept, and x and y are variables that represent coordinates on the line; generally, you will see them remain as x and y in the equation. In this form, you can easily determine the slope of the line as the variable "m".
- The equations in this are 2y - 12x = 20 and y = 6x -1. They both must be in slope-intercept form. The second equation is already in slope intercept form but not the first. So we need to convert the first equation in slope intercept form.
-
Rewrite the formula of the line in slope-intercept form.
- To convert the first equation in slope intercept form, we need to add 12x on both sides of the equal sign to get, 2y = 12x + 20 then we divide 2y by 2 as well as the other side of the equal sign to get 2y/2 = 12x/2 + 20/2 to get y = 6x + 10.
-
Compare the slopes of each line. Remember, when two lines are parallel to each other, they will have the exact same slope. Using the equation y = mx + b where m is the slope of the line, you can identify and compare the slopes of two lines.
- In our example, the first line has an equation of y = 6x -1, therefore its slope is 6. The other line has an equation of y = 6x + 10 which also has a slope of 6. Since the slopes are identical, these two lines are parallel.
- Note that if these equations had the same y-intercept, they would be the same line instead of parallel.
Perpendicular Lines
Two lines are Perpendicular when they meet at a right angle (90°).
To find a perpendicular slope:
When one equation has a slope of m, an equation or line that is perpendicular to the first line or equation will have a slope of −1/m; in other words the negative reciprocal.
In examinations, when asked to find the equation of a line that is perpendicular to a given line, you will need to work out the gradient of one line before finding the gradient and equation of the other.
Example:
Find the equation of the line that is
- perpendicular to y + 4x = 10
- and passes though the point (7, 4)
To get the slope of the equation above, we need to solve for y which results in:
y= −4x+10 and the slope will be −4.
Using -4 as the slope, we will now need to plug the x and y values into the point slope formula to get the second equation. We will then look to see if this second equation has a slope that is the negative reciprocal of -4 which is 1/4.
So the perpendicular line will have a slope of 1/4:
y − y1 = (1/4)(x − x1)
and now put in the point (7, 4):
y − 4 = (1/4)(x − 7)
and that answer is good but let us also put it in "y=mx+b" form:
y − 4 = x/4 − 7/4
we then add 4 to both sides of the equation so that: x/4 – 7/4 + 4 to get:
y = x/4 + 9/4
Because the slope of the second equation is x/4 or 1 /4 which is the negative reciprocal of -4, then the second equation is in fact perpendicular to the first equation above.
Slope of Undefined line Vertical and Horizontal Lines
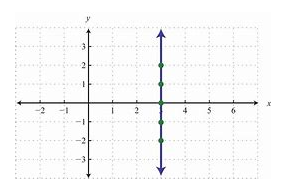
The slope of a vertical line is undefined
This is because any vertical line has a Δx Δx or "run" of zero. Whenever zero is the denominator of the fraction in this case of the fraction representing the slope of a line, the fraction is undefined. The picture below shows avertical line (x=3).
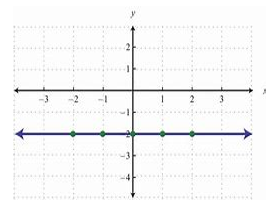
The slope of a horizontal line is zero
This is because any horizontal line has a Δy Δy or "rise" of zero. Therefore, regardless of what the run is (provided its' not also zero!), the fraction representing slope has a zero in its numerator. Therefore, the slope must evaluate to zero. Below is a picture of a horizontal line--you can see that it does not have any 'rise' to it. In this case, the slope is y = -2
Quadratic Functions
Quadratic functions are those of the form, f(x) = ax2 + bx + c
Where a, b and c are all integers and f(x) which is y is the dependent variable
a is the coefficient of x2
b is the coefficient of x
c is the y intercept
x is the independent variable
Example
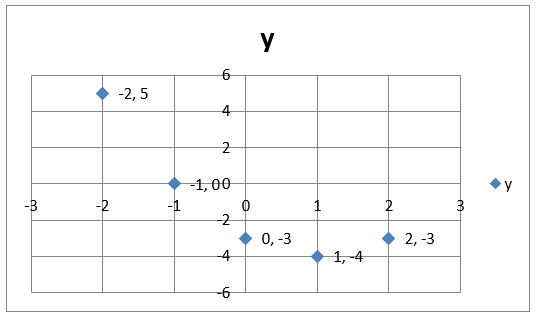
Draw the graph of the quadratic function, f(x) = x2 – 2x -3, for the domain -2 ≤ x ≤ 2.
Solution:
The set of (x, y) values to be plotted and connected in forming the graph representing the quadratic function, parabola (a smooth curve), are found by substituting the values given for x in the domain (-2, -1, 0, 1, 2), in the function, solving for the respective f(x)/ y values.
Given, f(x) = x2 – 2x – 3
Then,
f(-1) = (-1)2 – 2(-1) – 3 = 1 + 2 -3 = 0
f(0) = (0)2 – 2(0) – 3 = 0 – 0 – 3 = -3
f(1) = (1)2 – 2(1) – 3 = 1 -2 – 3 = -4
f(2) = (2)2 – 2(2) – 3 = 4 – 4 – 3 = -3
f(-2) = (-2)2 – 2(-2) – 3 = 4 - 4 – 3 = 5
Therefore the set of (x, y) values are: {(-2, 5), (-1, 0), (0, -3), (1, -4), (2, -3)}
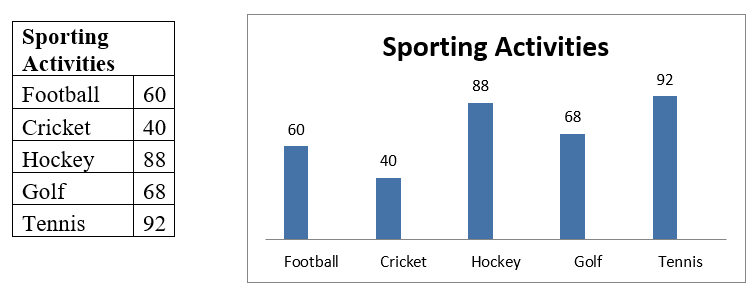
Bar Chart
A bar chart is a type of graph that is used to display and compare the number, frequency or other measure such as the mean for different discrete categories of data. In the example below, the bar chart shows the amount of people who participate in certain sporting activities.
Pie Charts
A pie chart is a circular diagram divided into sectors, with the size of each sector representing the magnitude of data it is showing. Each sector of a pie chart can be displayed in percentages. For example, using the data on sporting activities above, the pie chart looks as follows:

Line Graphs
Line graphs are mostly used in depicting trends. A line graph is drawn by connecting a line to consecutive values.
Example, the line graph for the sporting activities above is as follows: