Previous - Theory Of Cost Of Production
Market Structure
Market structure is best defined as the organisational and other characteristics of a market which determine the performance of the firm in that market. There are four main types of market structures:
- Perfect Competition
- Monopoly
- Monopolistic Competition
- Oligopoly
Main Characteristics of Market Structures
The main criteria by which one can distinguish between different market structures are
- The number of sellers - there may be many, one or a few,
- The type of product sold- some firms sell identical (homogenous) products while others sell different brands (heterogeneous),
- Barriers to entry into and/or exit out of the market- these include factors such as high cost of production, specialised technology, licenses and control over natural resources,
- Control over price - in some markets, firms are price setters which means that they have total control over the price set in the market. In other markets, firms are price takers and cannot set their own price but depend on the price set by the market.
Types of Market Structures
- Perfect Competition – in this market structure, there are many buyers and sellers. The product being sold is very similar or homogeneous. It will be expected that price elasticity of demand will be very high in this type of market structure (perfectly elastic demand). In this case, price increases will lead to decreases in total revenues and profits because buyers will go to other sellers because of the now increased price.
- Monopoly – this is where there is only one seller of a product or service. Monopsony is when there is only one buyer in a market.
- Monopolistic competition – this is a market structure that falls between perfect competition and monopoly. In this market structure, there are many independent firms which have a very small proportion of the market share. The product can be differentiated – advertising plays a huge role in this type of structure.
- Oligopoly – in this market structure, the market is dominated by a small number of firms which own more than 40 percent of the market share.
Profit Maximization of the Perfect Competitor in both the Short and Long Run
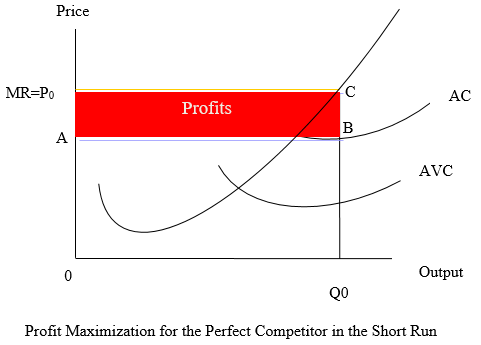
Short-Run
Short-run profit maximization is achieved at the output level where marginal revenue equals marginal cost (MR=MC) as can be seen in the following graph. In this type of market structure, MR is equal to the demand curve or average revenue curve or price. It must be remembered that the demand curve for the perfect competitor is horizontal. The reason for this is that there are many sellers and buyers in the industry. At the point where MR=MC, this MR must be greater than the average cost and the average variable cost. Profits are shown by the shaded area (MRABC) where price is greater than average cost.
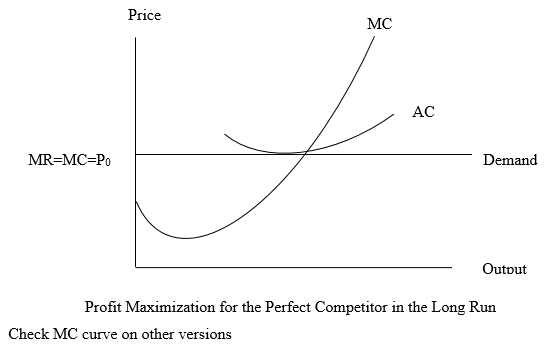
Long Run
However, in the long period, because of the large short run profits, new firms will enter the market and these large profits will be eroded due to the high level of competition. The result will be normal profits where price will equal average costs as in the graph below.
Profit Maximization for the Monopolist in the Short and Long Run
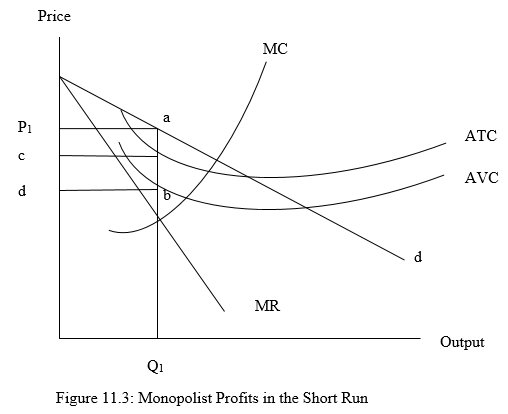
Short Run
Monopoly power is the control over price that a pure monopoly holds. The demand curve facing the firm is therefore downward sloping. Profit maximization requires that output be Q1 which is where marginal revenue (MR) curve intersects the marginal cost (MC) curve from below. Price is determined from the demand curve at point “a” as can be seen in the following graph. So price is P1 which is greater than the average total and average variable costs. This gives a profit equal to the area of P1abd.
Long Run
As in every other market, the presence of economic profit is a signal to investors that entry into this market provides an opportunity to make abnormal profits. Thus, this is where the issue of barriers to entry, that is, the ability to preserve its monopoly, becomes critical to the firm. It is therefore possible that a monopoly will make abnormal profit in the long run as well as the short run as shown in the above graph.
Profit Maximization of the Monopolistic Competitor in both the Short and Long
A monopolistic competitive market structure is one in which there are a large number of sellers or suppliers whose products can be differentiated where there are low barriers to entry Monopolistic competition differs from perfect competition in that different sellers have distinct traits which differentiate the goods of one seller from those of another seller who has control over setting the price in the market.
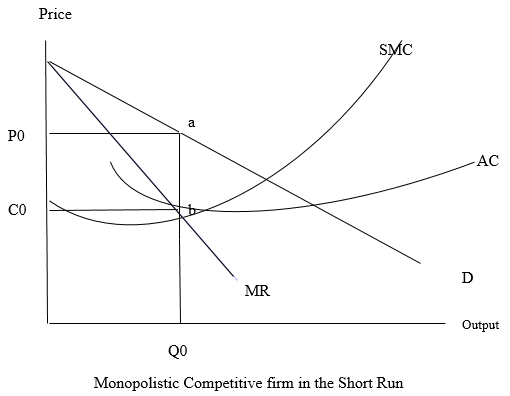
Short Run
Profit maximization occurs where marginal revenue equals marginal cost with output Q0, and the firm charges what the market will sustain, P0 according to the demand curve. In this case, average cost is C0, and the firm is making an abnormal profit equal to the rectangle P0abC0 as can be seen in the graph below.
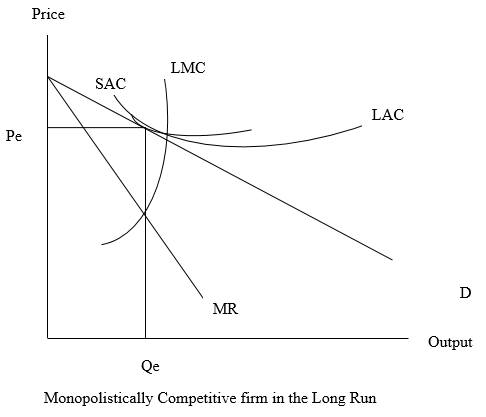
Long Run
Profit plays the same role in monopolistic competition as it does in perfect competition - it is a signal to entrepreneurs to enter or exit a market. As in perfect competition, in the long run the incentives drive profit to zero. At the output Qe the firm charges Pe, which just equals both the short run average cost and long run average cost.
Oligopoly
Oligopolistic competition can give rise to a wide range of different outcomes.
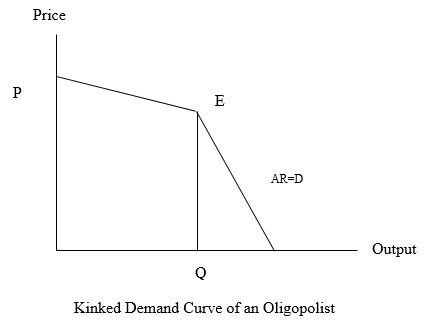
Demand Curve of an Oligopolist
The demand curve for the oligopolist has a kink at point E as seen in the graph below and thus, the demand curve has an elastic and an inelastic portion. Above the kink, demand is relatively elastic because all other firms’ prices remain unchanged. Below the kink, demand is relatively inelastic because all other firms will introduce a similar price cut, eventually leading to a price war. Therefore, the best option for the oligopolist is to produce at point E which is the equilibrium point and the kink point.