Previous - Theory Of Consumer Choice
Concept of Supply
Supply is defined as the total amount of a specific good or service that firms are able to produce and offer for sale. It is the total amount of a product (good or service) available for purchase at any specified price.
Like the demand side where there is a difference between demand and quantity demanded, there is also a difference between supply and quantity supplied. Supply is shown as a shift of the entire supply curve while quantity supplied is shown as a movement along the supply curve. Quantity supplied is influenced only by price while supply is influenced by such factors as cost of production, number of consumers and the state of technology.
Law of Supply – Movement along the Supply Curve
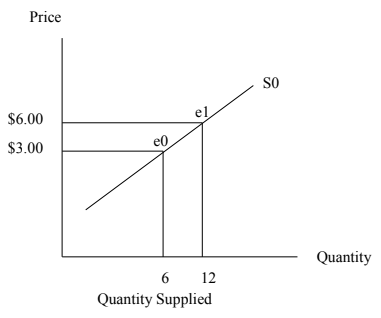
Quantity supplied is that amount of goods that firms supply at a particular price level. When the price of the product rises, for example, from $3.00 to $6.00, quantity supplied will increase from 6 units to 12 units which will be depicted as an upward movement along the supply curve from e0 to e1 as can be shown in the following graph.
Law of Supply – Shifts in the Supply Curve
As stated above, quantity supplied is affected mainly by price and is shown as a movement along the supply curve. On the other hand, supply is determined by other factors and these are represented by a shift of the entire supply curve. These factors are cost of production, number of customer and state of technology.
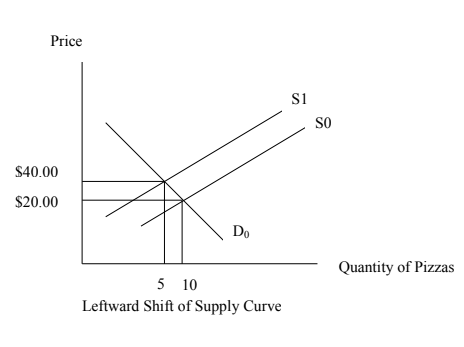
Cost of production – when costs of production for pizzas increase, this will make it expensive for producers to produce and so supply will fall. This will cause the supply curve to shift to the left from S0 to S1 with the supply of pizzas falling from 10 pizzas to 5 pizzas as shown in the following graph. Eventually price will increase from $20.00 to $40.00 due to the reduced supply of pizzas.
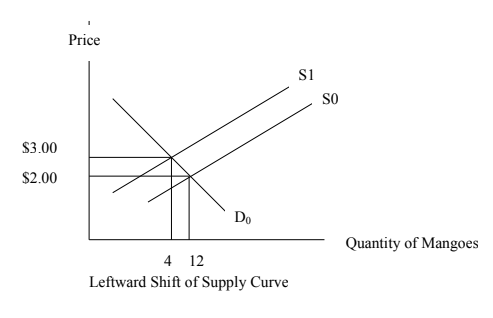
Number of Consumers – the smaller are the number of consumers for mangoes, the smaller will the market be for mangoes and so the less will be the supply of mangoes. Assuming the supply curve for mangoes was at S0, the supply curve will now shift up to the left to S1 with supply falling from 12 mangoes to 4 mangoes. Because there is less mangoes on the market, the price of mangoes will now rise from $2.00 to $3.00 as shown in the following graph.
State of Technology – the more advanced is the state of technology or if there is an improvement in technology, the more will manufacturers be able to produce. This will cause the supply curve to shift to the right thereby increasing output and decreasing price. On the other hand, if there is stagnation in the state of technology or if technology is obsolete, supply will fall with the supply curve shifting upward to the left with output declining and price increasing.
The Impact of Taxes and Subsidies on Supply
An increase in tax will result in an increase in prices and so supply will fall. This will have the effect of shifting the supply curve up to the left. On the other hand, if the tax rate is low, then price will be low and so supply will tend to increase which will shift the supply down to the right. Subsidies also affect supply in that when the government gives a subsidy, the price of the product will be lower and consumers will demand more of the product and then suppliers will want to increase supply. This will have the effect of shifting the supply down to the right.