Previous - The Nature Of Economics
The Economic Model
An economic model is a theoretical construct that attempts to abstract from complex human behavior in a way that sheds some insight into a particular aspect of that behavior. The formulation of a model can be in the form of words, diagrams or mathematical equations, depending on the purpose of the model. In order for a model to effectively represent reality, assumptions are needed. This will mean that certain factors and variables may need to be held constant. Therefore, some of the variables in the model will be variable while some will be fixed or constant. One of the main assumptions in modeling consumer behavior is that consumers are rational in that there choices are sensible. If consumers do not behavior rational, the model will not be able to effectively represent consumer choice in demanding goods and services.
Variables and Constants
A variable is a number that changes over time or can take on other values in different situations. There are two types variables: (1) an independent variable (also called exogenous variable) which can take different values and can result in changes in other variables and (2) a dependent variable (also called endogenous) which can take different values only in response to changes in the independent variable; therefore, the dependent variable depends on the independent variables. On the other hand, a constant is different from a variable and can be defined as a unit of measurement that does not change or vary such as fixed cost.
Equations
Economic theory is a verbal expression of the functional relationships between economic variables. When the verbal expressions are transformed into algebraic form we get equations. Equations are used to calculate the value of an unknown variable. An equation specifies the relationship between the dependent and independent variables. For example, the functional relationship between consumption (C) and income (Y) can take different forms. The most simple equation, C = a (Y) states that consumption (C) is related to income (Y).
Here ‘a’ is constant and it has a value greater than zero but less than one (0<a<1). Thus the equation shows that C is a constant proportion of income. For instance, if ‘a’ is ¼ then the consumer will always spend 25 percent of the income on consumption.
Lines Graphs
A graph presents the relationship between two or more sets of data or variables that are related to each other. The common method of constructing a graph or a diagram is described below:
The TC or total cost equation below is a model which can be represented as a line graph such as follows:
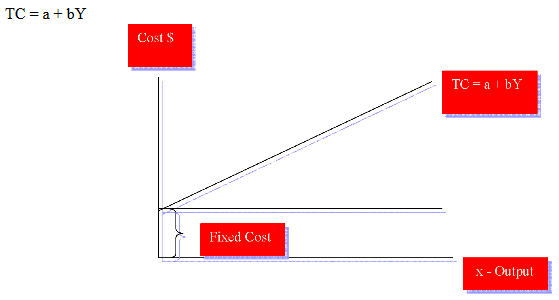
In this line graph, the rate of change of cost, b, is constant at all levels of output. This is what is meant by a linear function (the slope remains constant or the same whatever the level of output or production); “b” can be determined by dividing the change in TC by the change in Y. In this graph, “a” is the constant term and cuts the TC -axis. In this example, TC represents total cost and Y income or output. Notice that one of the lines in the graph is rising which states that as income rises, so too will cost rise; this is the variable cost. Also notice that the other line in the graph is a horizontal line which states that as income rises, this particular cost will be fixed which represents the fixed cost. A linear function is a straight line as in the above graph.
There are instances where the graph is not linear but non-linear such as in the following graph.
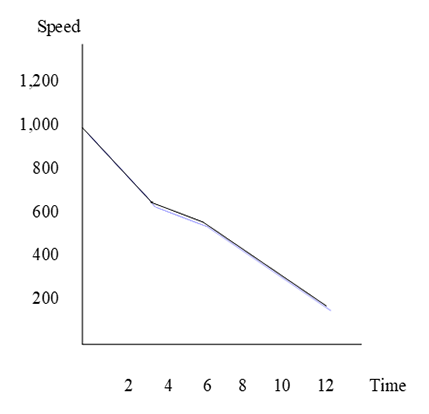
You can notice that the graph is not a straight line as in the case of the linear function.
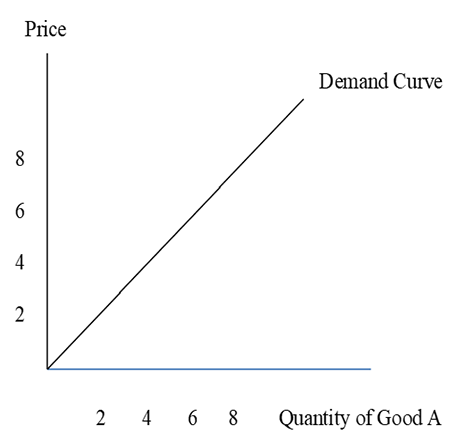
The slope of a graph is usually referred to as its gradient. Some gradients can be positive as in the graph below. We can see that as price of Good A rises, quantity demanded of it will also rise leading to a positive gradient or slope.
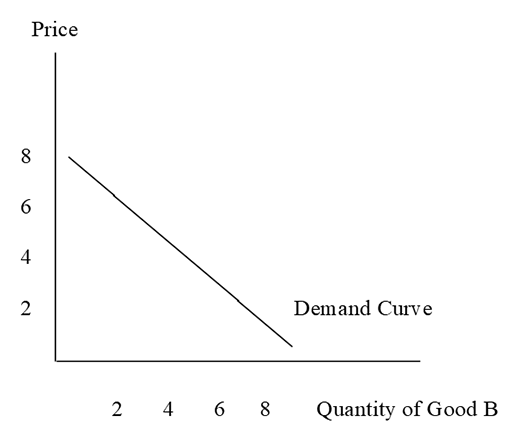
Other graphs can be negative as in the graph below. We can see that as price rises, quantity demanded for Good B falls leading to a negative gradient or slope.
Scatter Graphs
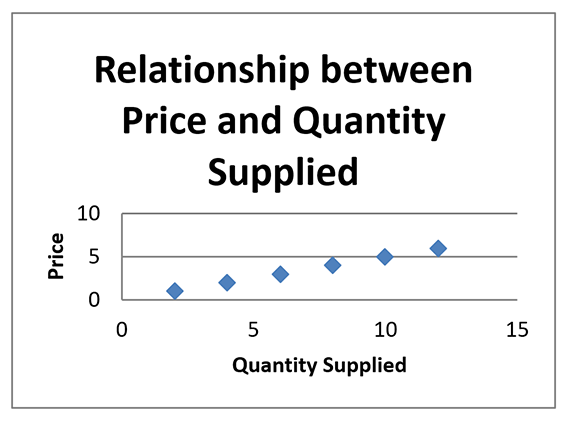
A scatter graph or plot is a type of graph or plot that shows the relationship between two variables such as between price and quantity supplied as in the following graph. We can see that this relationship is a positive, linear one in that the pattern of the plots follows a straight line in an upward direction. This will mean that as price increases, quantity supplied by suppliers will also increase because they will be able to earn higher profits.
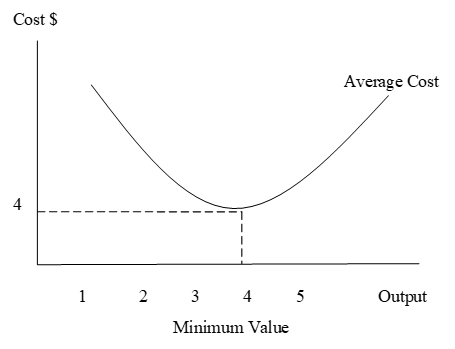
Minimum and Maximum Value Models
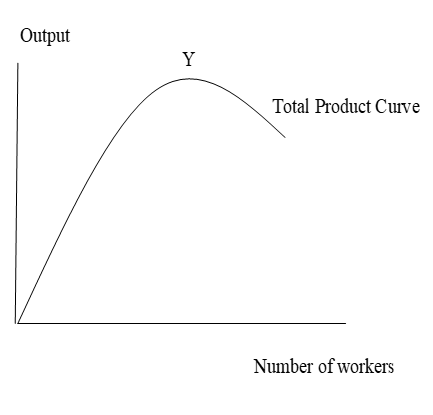
In terms of showing the maximum output, the total product curve can be used such as in the following graph which shows that total output or total product increases with increases in the number of workers.
The following graph shows the case of minimum values which is for the case of minimum total average costs. As can be seen, as output rises, costs falls, reaches a minimum which is at an output level of 4 units, then starts to rise.